
Here’s a little science for my students. I am going a little bit crazy trying to get a binding assay to work using fluorescence polarization (FP). The basic idea is this: take a constant amount of a fluorescent molecule (aptamer, Apt), add something that changes its fluorescence polarization (ligand, L), and measure the FP. As ligand is added, fluorescence polarization should change.

We measure the initial FP, add ligand, measure the FP again and look at the change. The total FP should be the weighted average of the bound and unbound quantities. So, we can model the delta-FP as a binding curve. We know the total Apt and L. For a given Kd we can calculate predicted concentrations of all the species. Delta-FP is proportional to the concentration of bound aptamer in in the product. That’s freshman chemistry and algebra.
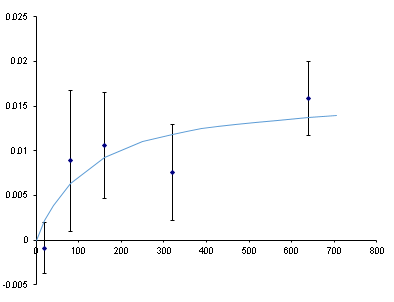
We If we guess the equilibrium constant and guess the maximum FP, we can compare to the experimental results. After a lot of guess-and-check (called a nonlinear fit and done automatically with the Excel Solver Add-in) we get a binding curve (line) that sort-of matches the data (dots). It suggests a Kd of ~100 nM which is within an order of magnitude of the Kd of this aptamer as measured by dot-blot… but look at those error bars. That’s the standard deviation among 3 replicates. Not good.
Why are these error bars so big? Sample preparation or instrument? We pipetted 24 samples of our 20 nM aptamer across one row of wells on the 384-well plate. The same solution went into each well. Results were disappointingly inconsistent.
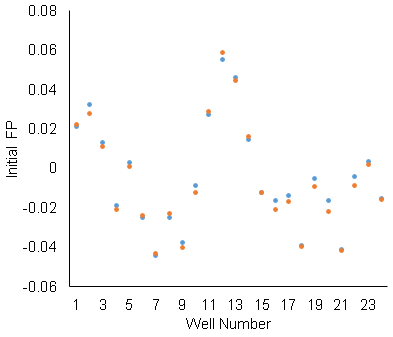
The well-to-well standard deviation is .02, which is as large as our maximum delta-FP signal. That’s not usable. The scan-to-scan repeatability is not as bad. The orange and blue data are repeated scans of the same row. Since the scan-to-scan repeatability is OK, we used delta-FP (before and after adding ligand) for the binding assay (rather than raw FP). The standard deviation of the delta-FP is .002. The change after adding ligand is as large as .015. So, maybe there’s something, but it’s still not good.
Why is it so bad and how can we fix it? We can go a higher on aptamer concentration. That will give better SNR and maybe overwhelm whatever the variable interference is from well-to-well. We can also take numerous data points for each well and average them. If the plate reader’s positional reproducibility is the problem, averaging should help.
