Author Archives: Peter

Basis supplement: pterostilbene and niacinamide

I took Elysium’s Basis supplement for a month but didn’t notice a dramatic effect. Basis is a supplement, a combination if pterostilbene and nicotinamide riboside. I switched to a cheaper combination of generic  pterostilbene and niacinamide. After two months, I think maybe there’s a small effect? I have very strange dreams if I take it before bed. I take it in the morning instead and maybe I feel a little more energetic.

Pterostilbene is the methylated version ofresveratrol. Resveratrol is derived from red wine. Pterostilbene is found in blueberries. It’s the subject of a lot of study for its antioxidant and supposed anti-aging properties. The methylations may make it easier to absorb.
pterostilbene and resveratrol.png
I can’t vouch that it works, but the Basis brand combination has some strong scientific support. Several Nobel prize winners are on their scientific board of advisors. Their hypothesis is that  NAD+ declines with age and that these two components might increase production of NAD+.
The supplement industry is largely marketing and deception. On the other hand, it would be hard to organize a proper clinical trial. If this company can follow the effects of their unregulated supplement product on their customers, it might give enough data to justify a proper trial. I wish them luck, but I’ll go with the generic product, given the price.
Thermofluorimetric analysis, continued

I am happy to report that the key controls worked on the thermofluorimetric analysis protocol I am adapting from the Easley lab’s  Analytical Methods paper. The protein does not give any significant signal in the absence of DNA. That’s key: we need to know where the fluorescence is coming from. Additionally, substituting a non-aptamer DNA of the same size does not give significant ΔdF/dT signal at the key temperatures we were tracking for the aptamer-protein complex. So that signal is specific not only to DNA but to aptamer DNA.

The aptamer I’m working with is frustratingly promiscuous. That’s bad. But the thermofluorimetric analysis is consistent with the binding screen with fluorescein-modified DNA.That’s good.

All-in-all, I’ve had more success in 4 days with thermometric analysis than I had in 6 months with fluorescence polarization.

Thanksgiving turkey with data

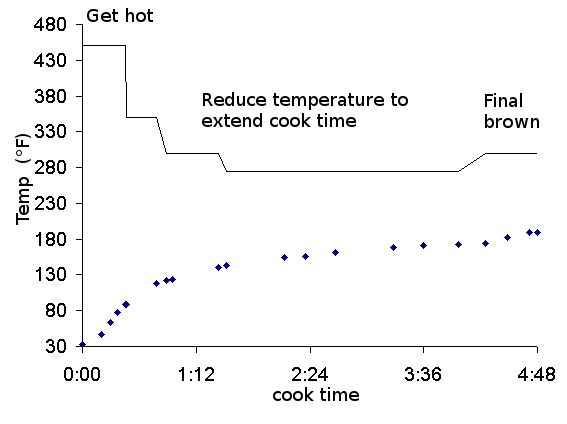
I am a huge fan of the Martha Stewart turkey recipe. It always comes out moist and flavorful. This year I substituted quartered onions, thyme and garlic for stuffing. I also decided to collect temperature data over time and see if I could get it to hit 180 °F at 40 minutes before plating. Here’s how that worked out.

I thawed my turkey in cold water overnight. Estimated time for cooking a defrosted 16 pound turkey range from 4-6 hours. I decided to plan for the worst and give myself 6. Once it was apparent I was going to be able to be done in 4, I reduced my cook temperature (top trace)

turkey temp.png

We had people coming by to eat at 3:00. I hit 180 at 1:30, but I went to 190 just to be sure. I pulled the bird at 1:50. That gives the bird time to rest. So long as nobody is late, that’s not bad timing. I’m glad I built the spreadsheet.


FP binding assays, time to give up

After too many hours, I’m giving up on fluorescence polarization (FP) as a generic binding assay. Clearly, it works in some cases with some labels. I got a weak response from one of the aptamers I tried, but another two failed to show anything. And I’m screaming for signal even in the “positive” case. Published results suggest several other aptamers have a FP shift upon binding. But, clearly, not all of them.

For a dye like fluorescein, the local environment around the molecule is probably more important than the size of the complex. So, unless binding changes the conformation in a way that is near to the dye, there’s no FP change. It would be interesting to try a survey of published DNA aptamers and their targets to see which show an FP change and which don’t. The results could be related to structural elements. That could inform design. One group did do some design work to make a FP-aptasensor for small molecules. The binding site and the fluorophore modification were strategically placed close together so that binding was more likely to affect FP. More work in this direction could help such designs. But, ultimately, FP is not as generically useful as I would like.

Today I tried thermofluorimetric analysis based on work by the Easley lab at Auburn University. I got immediate results from two published aptamers comparable to the results in their Analytical Methods paper.

The basic idea is to melt the aptamer and then look for the changes in the melt curve after addition of the target. The target should stabilize the aptamer, so there should be a peak in the melt curve at higher temperatures. Indeed, when I add protein to my aptamer, I see such a peak. I did it at multiple concentrations and it looks like a binding curve. But when I fit the data I get a weaker Kd than the original papers suggested.

It seems to me that deriving the dissociation constant using this method will inherently report the equilibrium constant at elevated temperatures. The methods paper showed strong binding, but they chose a particularly strong sub-nanomolar aptamer as proof of concept. They didn’t show a Kd calculation. So maybe at 62 °C the 0.1 nM aptamer is acting like a 1 nM aptamer. That would be a lot weaker than the original but would still give a clear binding curve.

I need to try more conditions to prove that I’m able to derive a Kd from thermofluorimetric assay. Or not.

I also need to do a protein-only control. My DNA dye should be pretty specific, but it’s important to check that it’s not interacting with the protein and giving spurious signals.

FP binding assays, sanity check

When I am confronted with a frustrating problem, I like to run a “sanity check” to test my assumptions. For instance: I’m running this FP assay. When I add protein, I should get a change in the fluorescence polarization in my sample. There’s lots of literature that suggests it does happen.But is my instrument capable of detecting it?

As a sanity check, I ran control samples in my plate reader 36 times. I took  the plate out, put the plate back in, and ran the same samples in my plate reader 36 times. I need to know about my reader’s stability.

I expect a relatively small ΔFP. The fluorescein is attached to a 20 kD DNA aptamer which binds to a 16 kD protein. That’s not a very big change in molecular weight. The previous binding assay gave a max ΔFP of 10 mP. I need  a standard deviation of less than 3 mP to have any confidence this measurement.

Thankfully, the standard deviation of the ΔFP across 22 wells was 2 mP. The well-to-well-variability was terrible. Each well needs its own control.I can’t measure absolute FP with any accuracy, but I should be able to measure ΔFP if it’s greater than 6 mP. That gives me more confidence about the measurements from the last few days.

2016-11-21-11_45_46-20161121-052440_161015-fa-384-row-b-c_summry-average-xls-compatibility-mode

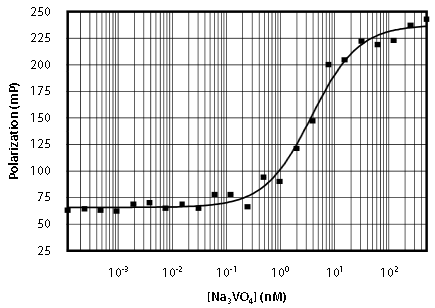
I looked for some literature to compare. A small fluorescein-labeled peptide (MW 1.3kD) binding to a large fusion protein (49 kD) gives a ΔFP of ~200 mP. The scatter around their curve is about 6 mP.That’s similar to my own. If I get a ΔFP of that magnitude, I should be able to measure it easily.  I measured the FP of erythrosin and got ~340 mP so I am definitely able to detect FP when it’s strong (literature value 316 mP).

2016-11-21-10_11_37-beacon_fluorescence_guide-pdf

From Invitrogen product literature