Author Archives: Peter

FP binding assays, continued

More science for my students. Yesterday, I showed a fluorescence polarization (FP) binding assay with frustratingly large error bars. The standard deviation among three replicates was disturbingly large. Put another way: three samples that were supposed to be the same looked different from one another. It would be like pouring three glasses of wine from the same bottle only to discover that one glass was red, one white, and one rose.

One possibility is that the samples are actually not as similar as we thought. Just because the three glasses of wine came from the same bottle doesn’t mean they were poured the same way. Maybe the bottle had sediment that made one glass look darker.

The other possibility is that the instrument is just not very good. In my wine analogy, maybe it’s not that the three glasses are different; maybe I just need to get my eyes checked. Or to stop drinking.

I tested that yesterday. The FP assay, not stopping drinking. Heaven forbid.

I filled seven wells with the exact same sample. I used a microscope to confirm that there were no bubbles (bubbles play mad hob with the FP measurement). I ran the same plate with 7 identical samples through the machine 15 times. Here’s what it looked like:

2016-11-18 06_50_19-20161117-100940_20161117_10.16-recovered.xlsx - Excel.png

What it should look like is seven overlapping flat lines. That word “should” is a dead giveaway that something is amiss. What I see here is a whole lot of noise. How can I correct for this? (short of buying a new plate reader – which I covet)

I can compensate by averaging. When I average across all 15 replications, I get one halfway decent measurement. I added protein to the experimental wells and took 15 more measurements. The control sample changed dramatically (-8.5 mP). To be clear, that control sample was not touched between the initial and final measurements. That apparent change in the first sample was introduced by the instrument.

2016-11-18 06_45_50-20161117-100940_20161117_10.16-recovered.xlsx - Excel.png

I can use the control as an internal standard to help correct that kind of variability. I took every individual fluorescence measurement and normalized it to the control sample. The run-to-run standard deviation increased from 6mP to 15 mP (presumably because I was adding independent noise from the standard well to the noise in the experimental wells). So there is no systematic across-the-row error. But it does correct the drifting background.
2016-11-18 06_46_02-20161117-100940_20161117_10.16-recovered.xlsx - Excel.png

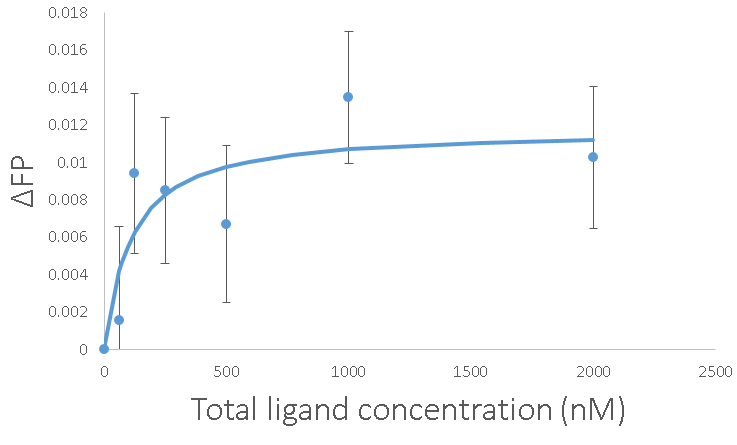
With all of that work, we can get marginally reliable measurements. The error bars are the standard error of the average with n=15. The Kd came out to 100 nM again, which gives me more confidence. Going about it this way has the advantage of being able to get those error bars down just by adding more replicates. It also has the advantage of not costing $20,000 for a new platereader.
Fluorescence polarization binding assays

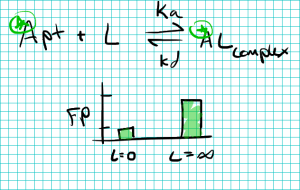
Here’s a little science for my students. I am going a little bit crazy trying to get a binding assay to work using fluorescence polarization (FP). The basic idea is this: take a constant amount of a fluorescent molecule (aptamer, Apt), add something that changes its fluorescence polarization (ligand, L), and measure the FP. As ligand is added, fluorescence polarization should change.

2016-11-17-06_12_27-krita

We measure the initial FP, add ligand, measure the FP again and look at the change. The total FP should be the weighted average of the bound and unbound quantities. So, we can model the delta-FP as a binding curve. We know the total Apt and L. For a given Kd we can calculate predicted concentrations of all the species. Delta-FP is proportional to the concentration of bound aptamer in in the product. That’s freshman chemistry and algebra.

2016-11-17-06_18_42-20161015-154131_161015-fa-384-row-l_allrawdata_10-15-2016_03-59-09-70-binding-as

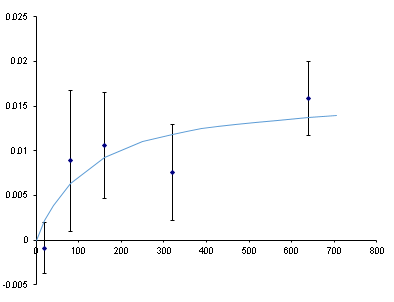
We If we guess the equilibrium constant and guess the maximum FP, we can compare to the experimental results. After a lot of guess-and-check (called a nonlinear fit and done automatically with the Excel Solver Add-in) we get a binding curve (line) that sort-of matches the data (dots). It suggests a Kd of ~100 nM which is within an order of magnitude of the Kd of this aptamer as measured by dot-blot… but look at those error bars. That’s the standard deviation among 3 replicates. Not good.

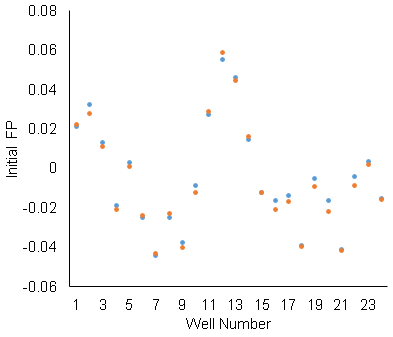
Why are these error bars so big? Sample preparation or instrument? We pipetted 24 samples of our 20 nM aptamer across one row of wells on the 384-well plate. The same solution went into each well. Results were disappointingly inconsistent.

2016-11-17 06_34_25-20161115-175035_20161115 Fluoprescenced polarization binding assay_ 384 row O_Al.png

The well-to-well standard deviation is .02, which is as large as our maximum delta-FP signal. That’s not usable. The scan-to-scan repeatability is not as bad. The orange and blue data are repeated scans of the same row.  Since the scan-to-scan repeatability is OK, we used delta-FP (before and after adding ligand) for the binding assay (rather than raw FP). The standard deviation of the delta-FP is .002. The change after adding ligand is as large as .015. So, maybe there’s something, but it’s still not good.

Why is it so bad and how can we fix it? We can go a higher on aptamer concentration. That will give better SNR and maybe overwhelm whatever the variable interference is from well-to-well. We can also take numerous data points for each well and average them. If the plate reader’s positional reproducibility is the problem, averaging should help.

Laser cut optical filter adapter

I bought an overstock optical filter for the lab’s plate reader (Beckman DTX-880). I want to analyze Hoechst dye fluorescence (excitation 350 nm, emission 453 nm). My new filter is the right size for the excitation filter slider, but too small for the emission filter slider. That’s probably because the 450 nm – 480 nm is a  very common excitation size but not a common emission size.

2016-11-07-05_32_59-krita

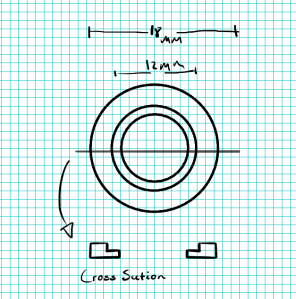
So, I need to either order another emission filter and custom size it to 18 mm diameter ($500) or I need to cut a little filter adapter ($free). I need something that will hold the 12 mm filter securely and block light. I envisioned something like this made from black plastic:

2016-11-07-05_37_50-krita

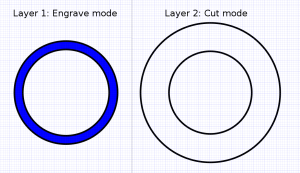
So I drew up 2 layers in Inkskape. The first layer made a partial engrave of a “rim” about 1mm into the 2mm thick plastic. The second layer cut the hole for the filter and then cut the part out of the plastic sheet:

2016-11-07-05_49_40-_filter-adapter-layerThe end result worked out pretty well. 2016-11-07-05_48_07-xnview-img_1590-jpgThe funny thing is that this laser cutter cost ~$300. So it has paid for itself already. Admittedly, it did take some troubleshooting… so maybe the cost benefit was not quite so clean. I had to replace the laser tube (which the company did supply) and I had to replace the power supply ($100). At this point I still call it a win.

Solar storage grid parity

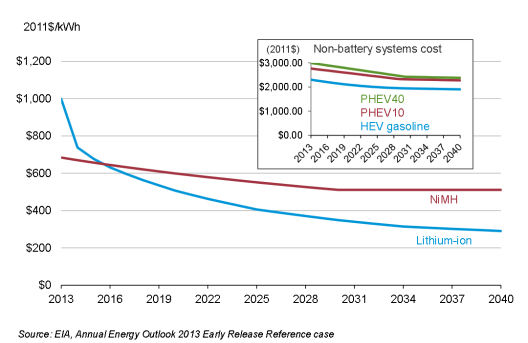
There are plenty of places where rooftop solar is at grid parity. We are approaching a time when stored solar electricity will be the cheapest power available even at night. Back in 2012, I estimated the battery price that would allow 24/7 solar to be as cheap as coal/nuclear electricity. I figured that stored solar would be in range of grid parity when batteries were ~$250 per kWh. In 2013, the EIA estimated that we would reach that price point in 2040.

2016-09-13 06_33_01-Annual Energy Outlook 2013 Early Release Reference Case - maples.pdf.png

The future is here early. Tesla and GM/LG are quoting prices from $140 to $190 per kWh. I suspect that if we tried to roll out a lot of grid-scale batteries, the additional demand would drive up the price (if only due to lithium supply problems). That being said, if you can do it with lithium, it’s doable with other chemistry. The constraints for stationary grid batteries are different than for vehicle batteries. Size and mass are less critical than price, for instance.

When long term energy scarcity is not a problem, I feel pretty optimistic about a lot of things.

Open Source Scientific Hardware

I love the idea of using open source hardware for laboratories. As someone who likes to tinker with his instruments, open source makes a lot of sense. If I build a spectrophotometer from parts, and all of the parts are well documented, I can make modifications and repairs more easily. It also makes sense from a monetary standpoint: I don’t have to pay for lots of support and infrastructure that I don’t want or need.

That being said,  there are some disadvantages:  there is no service contract associated with an open source instrument. If I buy something and I don’t know how to use it or repair it and it breaks, then I am simply out of luck.

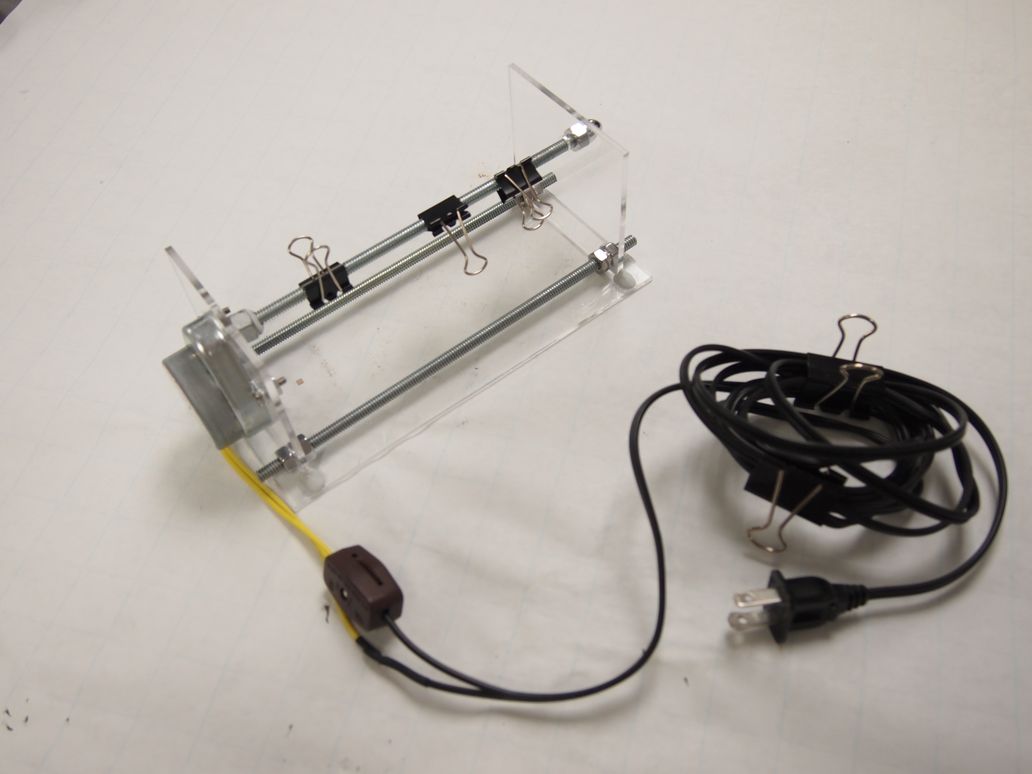
For now it makes the most sense to build simple instruments. I made an Open Source sample rotator for biology/chemistry laboratories. A new rotator for slowly stirring a solution during a reaction can be $300+ (Thermo wants you to request a quote!). I built one for about $50. The whole thing makes one rotation every 10 seconds. I secure vials to the rotating threaded rod using binder clips and/or tape.

OLYMPUS DIGITAL CAMERAIt works about as well as could be desired for a simple tool. There are lots of other examples. I published a short collection of others I made in the Journal of Biological Methods. There are some other great projects out there. One of my favorites is explained in a paper from the Pearce Lab at MTU. It was published in the Journal of Lab Automation. It talks about an open source liquid handling platform. The robots I had access to back in the day were just too intimidating – they were expensive and had a very steep learning curve. These will have a learning curve at first, but might at least be cheap.

Here are some other places that cover open source hardware:


Rotator Build notes:

I ordered the two square pieces and one rectangular piece of acrylic custom laser cut with appropriate holes from ponoko.com (CAD files are also available for cutting or downloading for modification). I also used one piece of threaded rod (.25 inch diameter, 20 threads per inch pitch) from the local hardware store. I cut that into three sections and used 9 nuts and 1 cap nut to secure it to the device. A attached the motor to the acrylic with two small machine screws I found in the lab. I locked the contact point between threaded rod and motor with epoxy paste. I solvent-welded the joints between the rectangle and squares with methylene chloride. I used a little bit of epoxy paste to reinforce the solvent-welded joints.

The switch, motor, and power cord were all ordered from McMaster Carr:

3867K12 Constant-Speed AC Gearmotor 6 rpm At 60 Hz  $23.57

14695K91 Inline on/Off Switch for Lamp  $ 2.64

7248K22 Power Cord with Two-Blade Plug 18 Gauge Wire, 9′ Long  $3.02